Executive Summary
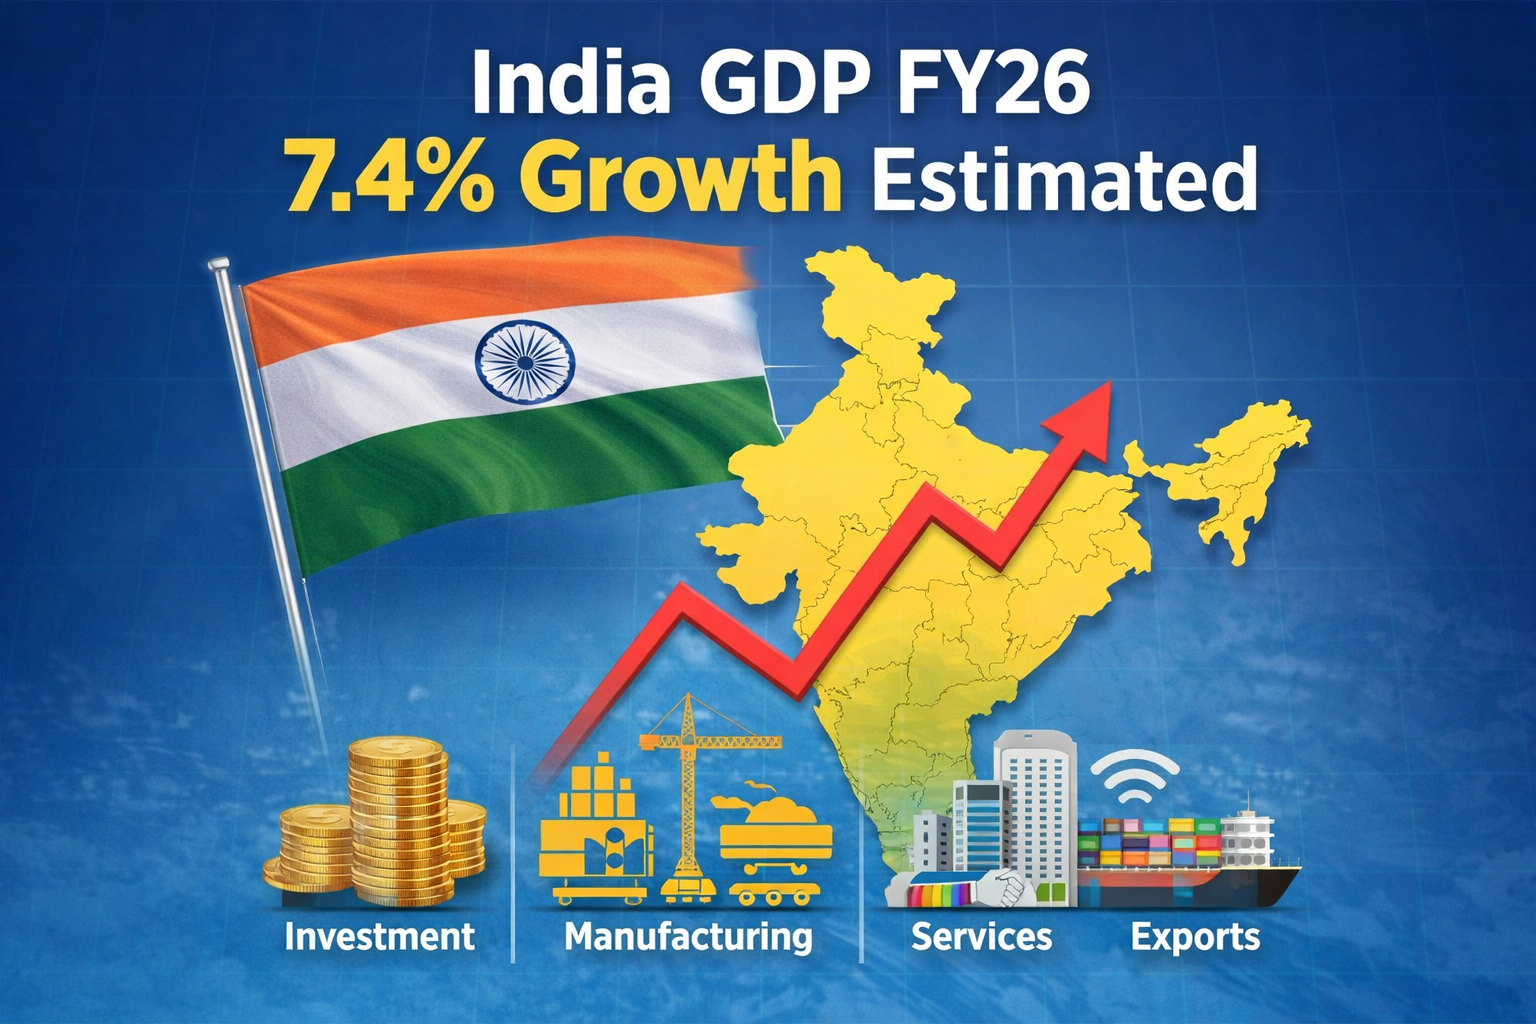
- India’s real GDP is estimated to grow 7.4% in FY 2025 – 26 versus 6.5% in FY 2024 – 25, indicating a rebound to a two-year high despite trade tensions and geopolitical uncertainty.
- Growth is led by services (estimated 9.1% versus 7.2% last year), supported by manufacturing (7.0% versus 4.5%) and construction (7.0% versus 9.4%).
- Agriculture is estimated to moderate (3.1% versus 4.6%), while mining is expected to contract (-0.7% versus +2.7%), making the composition of growth as important as the headline number.
- Nominal GDP growth is estimated at 8.0%, below the earlier budget assumption of 10.1%, which can influence fiscal ratios, tax buoyancy expectations, and pricing assumptions.
- The estimates are preliminary and will be revised as more data comes in; additionally, the statistical system is preparing a base-year revision to 2022 – 23 from the current 2011 – 12 series, which can affect levels and growth comparisons.
- For CXOs and investors, the immediate takeaway is to plan around services-led momentum and investment strength, while actively stress-testing trade exposure, rural-linked demand softness, and nominal-growth-sensitive assumptions.
Market Context and why now
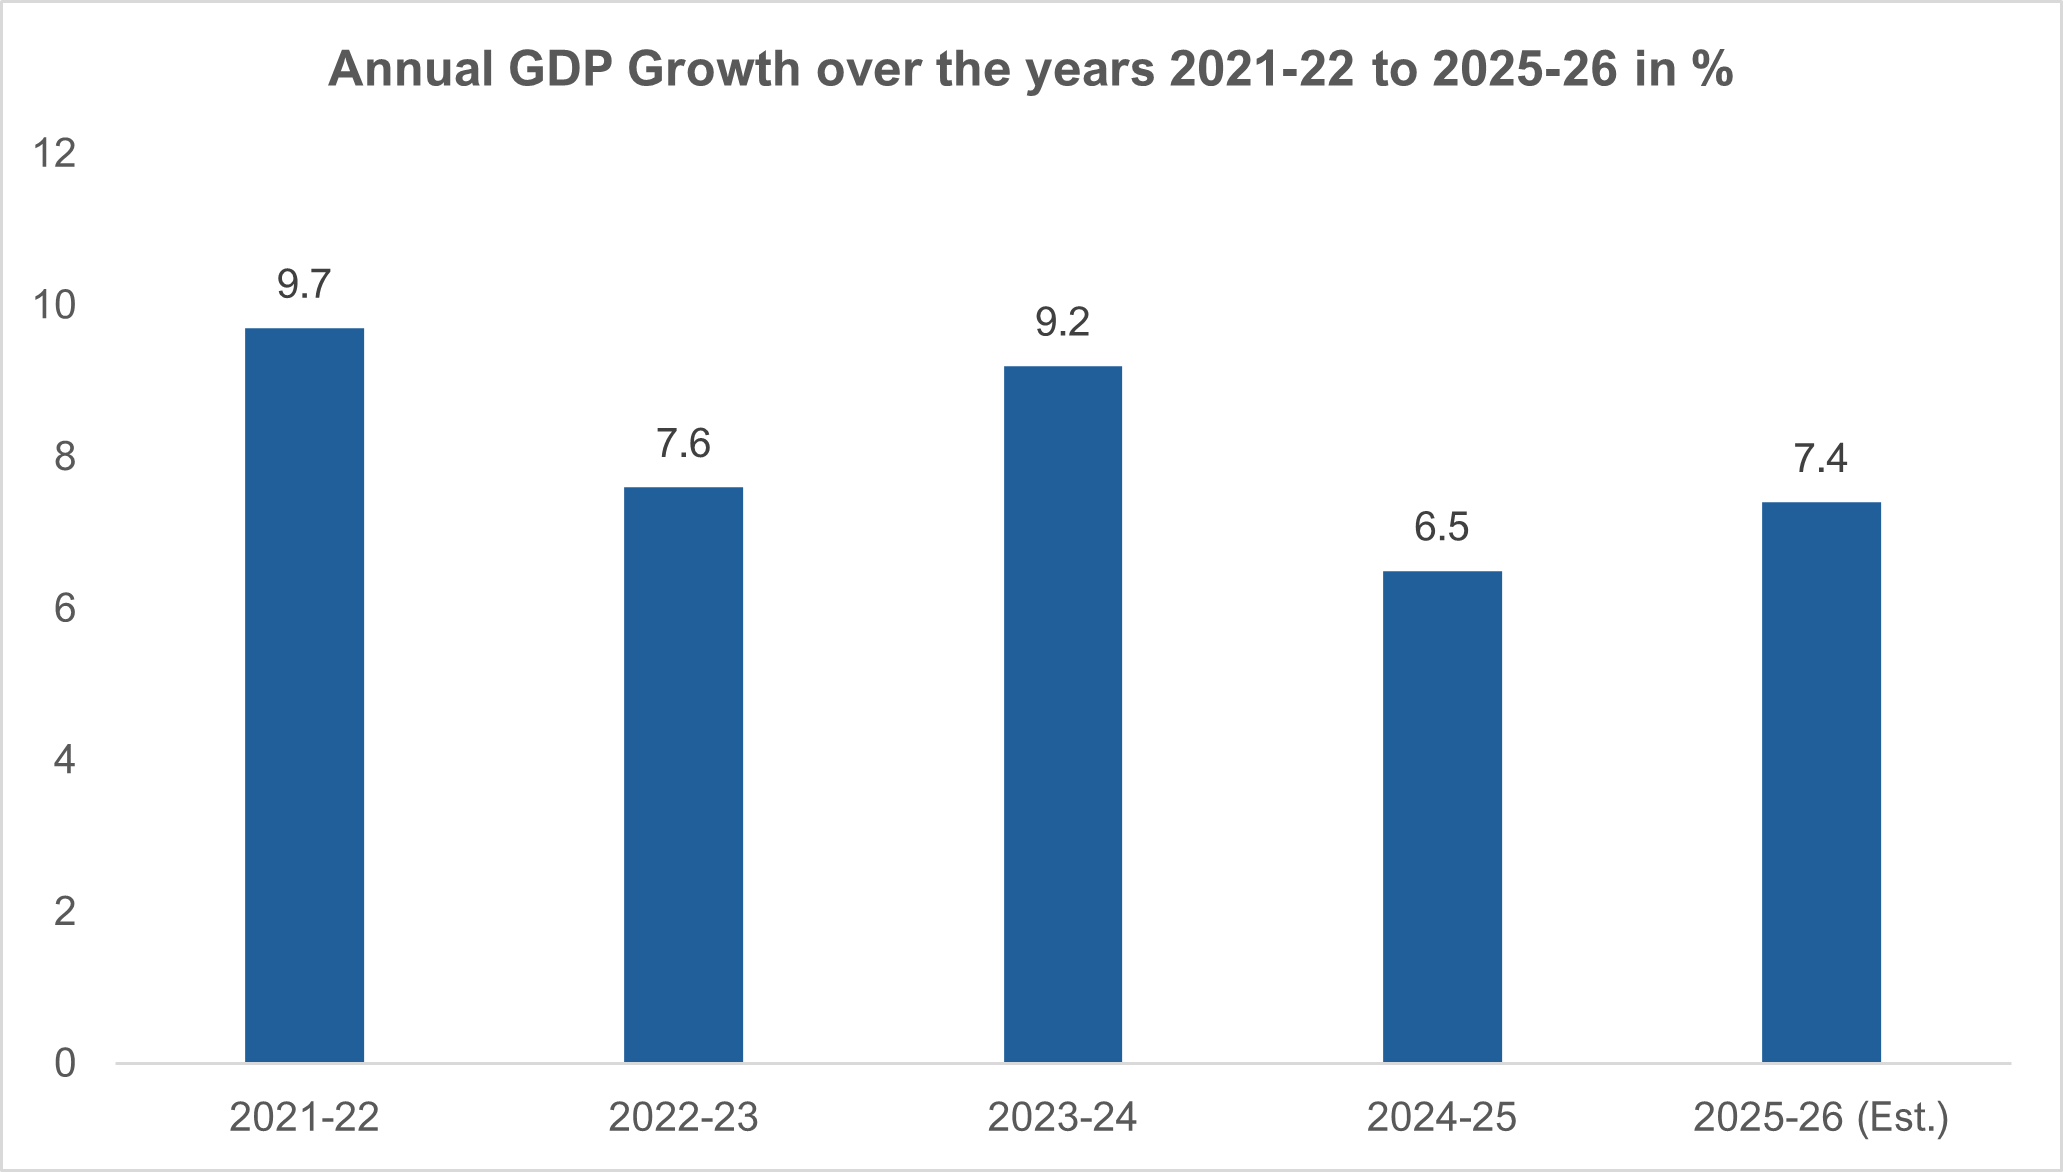
India’s FY 2025 – 26 first advance GDP estimate arrives at a time when corporate India is finalizing operating plans and policymakers are preparing budget numbers. The National Statistical Office (NSO) estimates real GDP growth at 7.4% for FY 2025 – 26, higher than the 6.5% recorded in FY 2024 – 25. The narrative accompanying the estimate attributes resilience to robust services growth and a recovery in manufacturing, even as trade tensions and external uncertainties remain elevated.
The estimate is also positioned as an important signal for India retaining its “fastest growing major economy” tag. However, these are advance estimates and will be revised as additional data becomes available as well as the statistical series is expected to undergo a base-year change as part of an index revamp, from the current 2011 – 12 series to a 2022 – 23 base year, which can influence the historical comparability of growth rates.
Supply-Side Composition: Where Growth Is Concentrated
Services
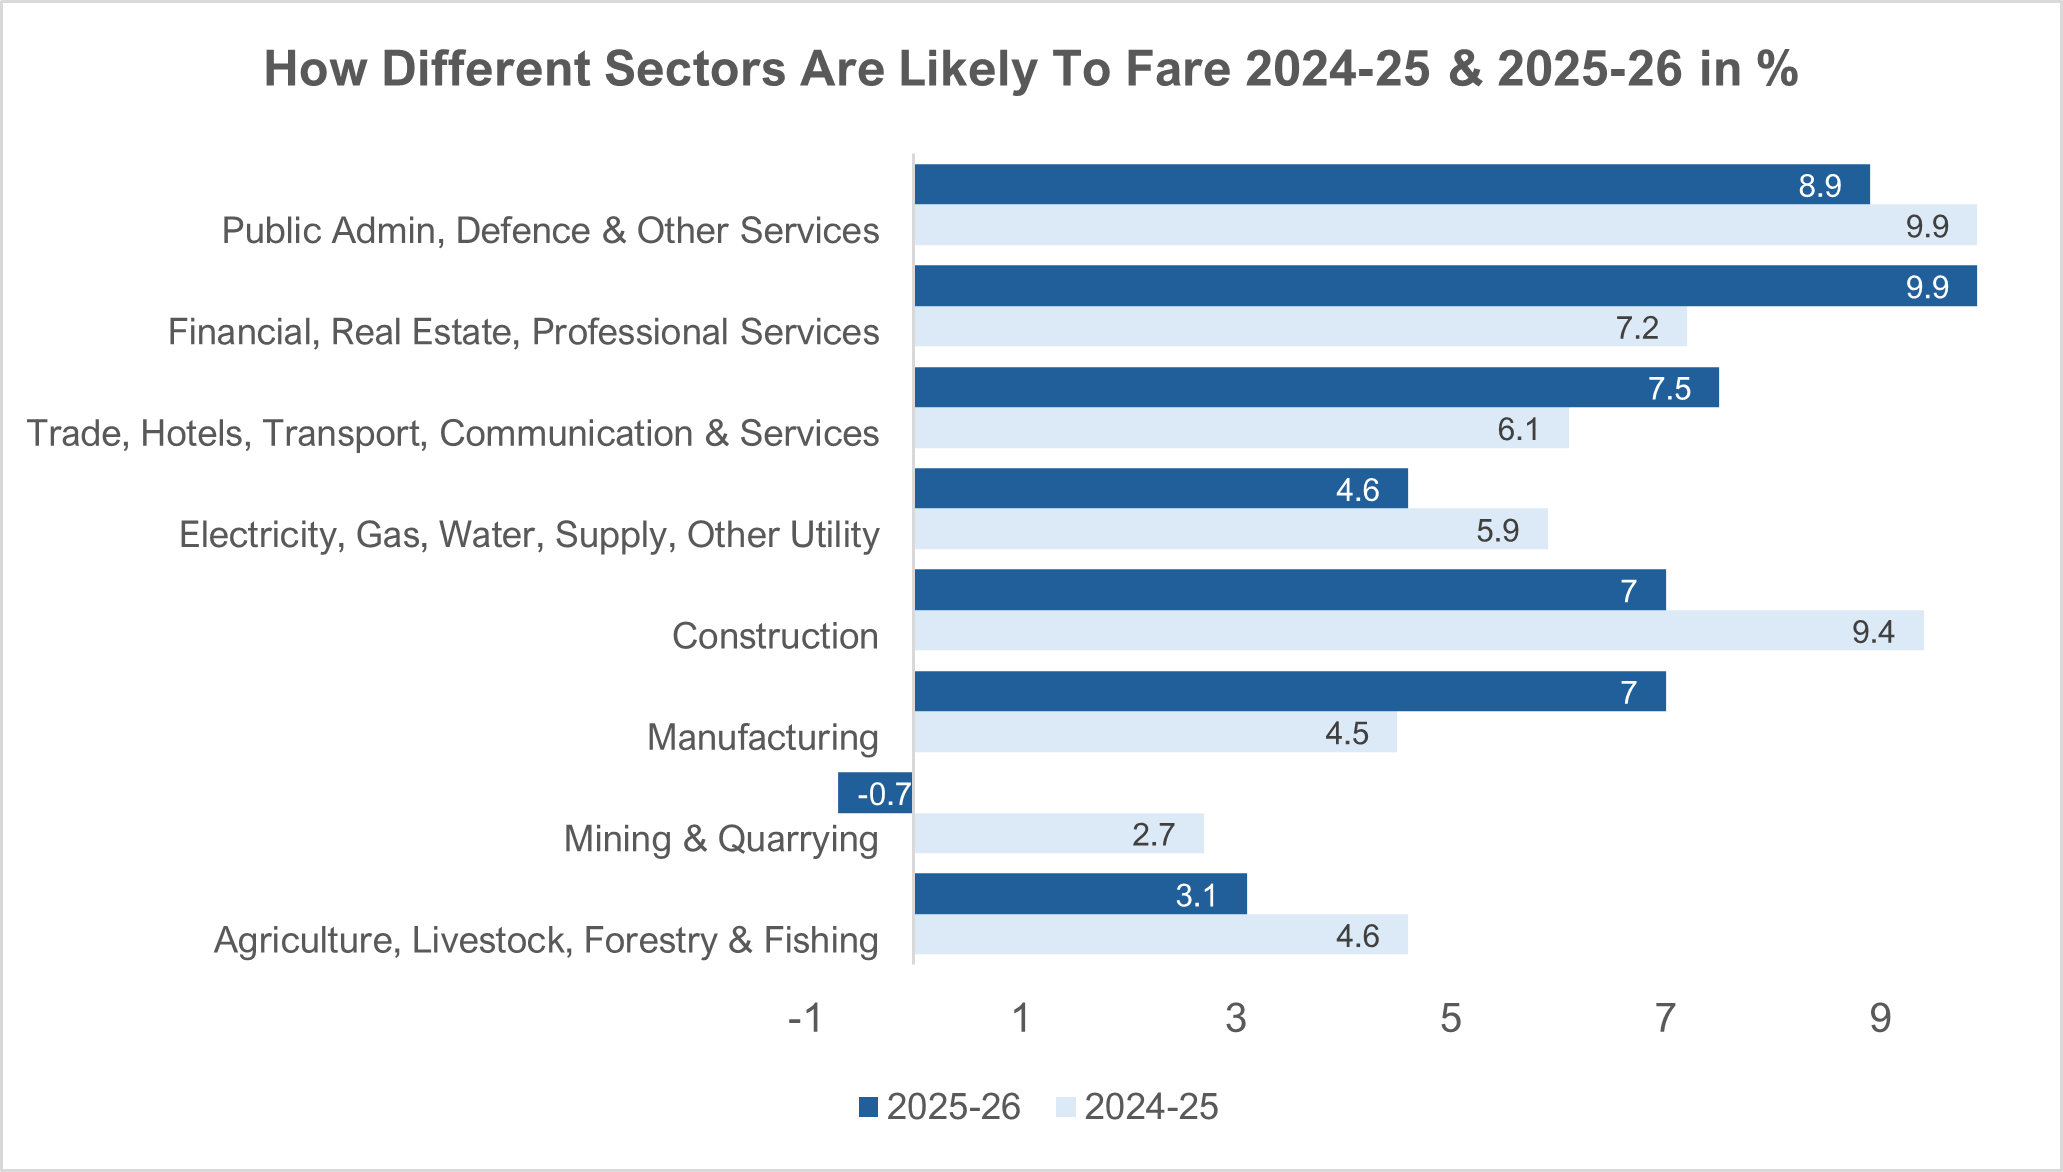
The services sector accounts for nearly 60% of the economy, is expected to power expansion with estimated growth of 9.1% in FY 2025 – 26 compared with 7.2% last year. This matters for business planning because services-led cycles typically manifest as stronger urban consumption, higher formal sector activity, and momentum in finance, professional services, trade-linked services, and consumption ecosystems.
Manufacturing And Construction
Manufacturing is estimated to grow at 7.0% in FY 2025 – 26, a marked improvement from 4.5% in FY 2024 – 25. Construction is estimated at 7.0%, still healthy, although lower than the 9.4% growth seen last year. This mix supports an “investment and execution” narrative: improving industrial output alongside sustained construction activity, albeit with some moderation.
Agriculture And Mining
The farm sector is estimated to grow 3.1% in FY 2025 – 26, slower than the 4.6% registered last year. Mining is expected to contract by 0.7% compared with growth of 2.7% last year. For many sectors, these two lines are not peripheral. They directly influence rural demand, commodity-linked supply chains, input availability, and cost volatility.
Exports and External Headwinds
Exports growth is estimated at 6.4% in FY 2025 – 26, slightly higher than 6.3% in FY 2024 – 25. Tariffs have not impacted exports to the extent feared. This does not eliminate risk, but it indicates near-term resilience in the face of external volatility.
Monetary and Macro Buffers
- Low inflation enabling the central bank to cut rates by 1.25% in 2025, supporting credit revival and demand.
- Favorable developments such as above-normal monsoons and low crude oil prices, alongside robust corporate balance sheets and accommodative monetary and fiscal policies.
The practical point for corporate planning is to recognize that macro support exists but is unevenly transmitted. It typically lifts credit-sensitive categories and capex-linked ecosystems first, while rural-linked demand responds more to farm incomes and monsoon outcomes.
Nominal Growth and the Fiscal Math: Why the 8% Matters
Nominal GDP growth is estimated at 8.0% for FY 2025 – 26, which is lower than the 10.1% assumed at the time of presenting the budget. This matters because fiscal deficit targets are measured as a percentage of nominal GDP. The gap between real and nominal GDP growth estimates is 0.6 percentage points, the lowest in the 2011 – 12 series, and that lower nominal growth can place pressure on deficit arithmetic.
Fiscal Deficit Target and the “Glide Path”
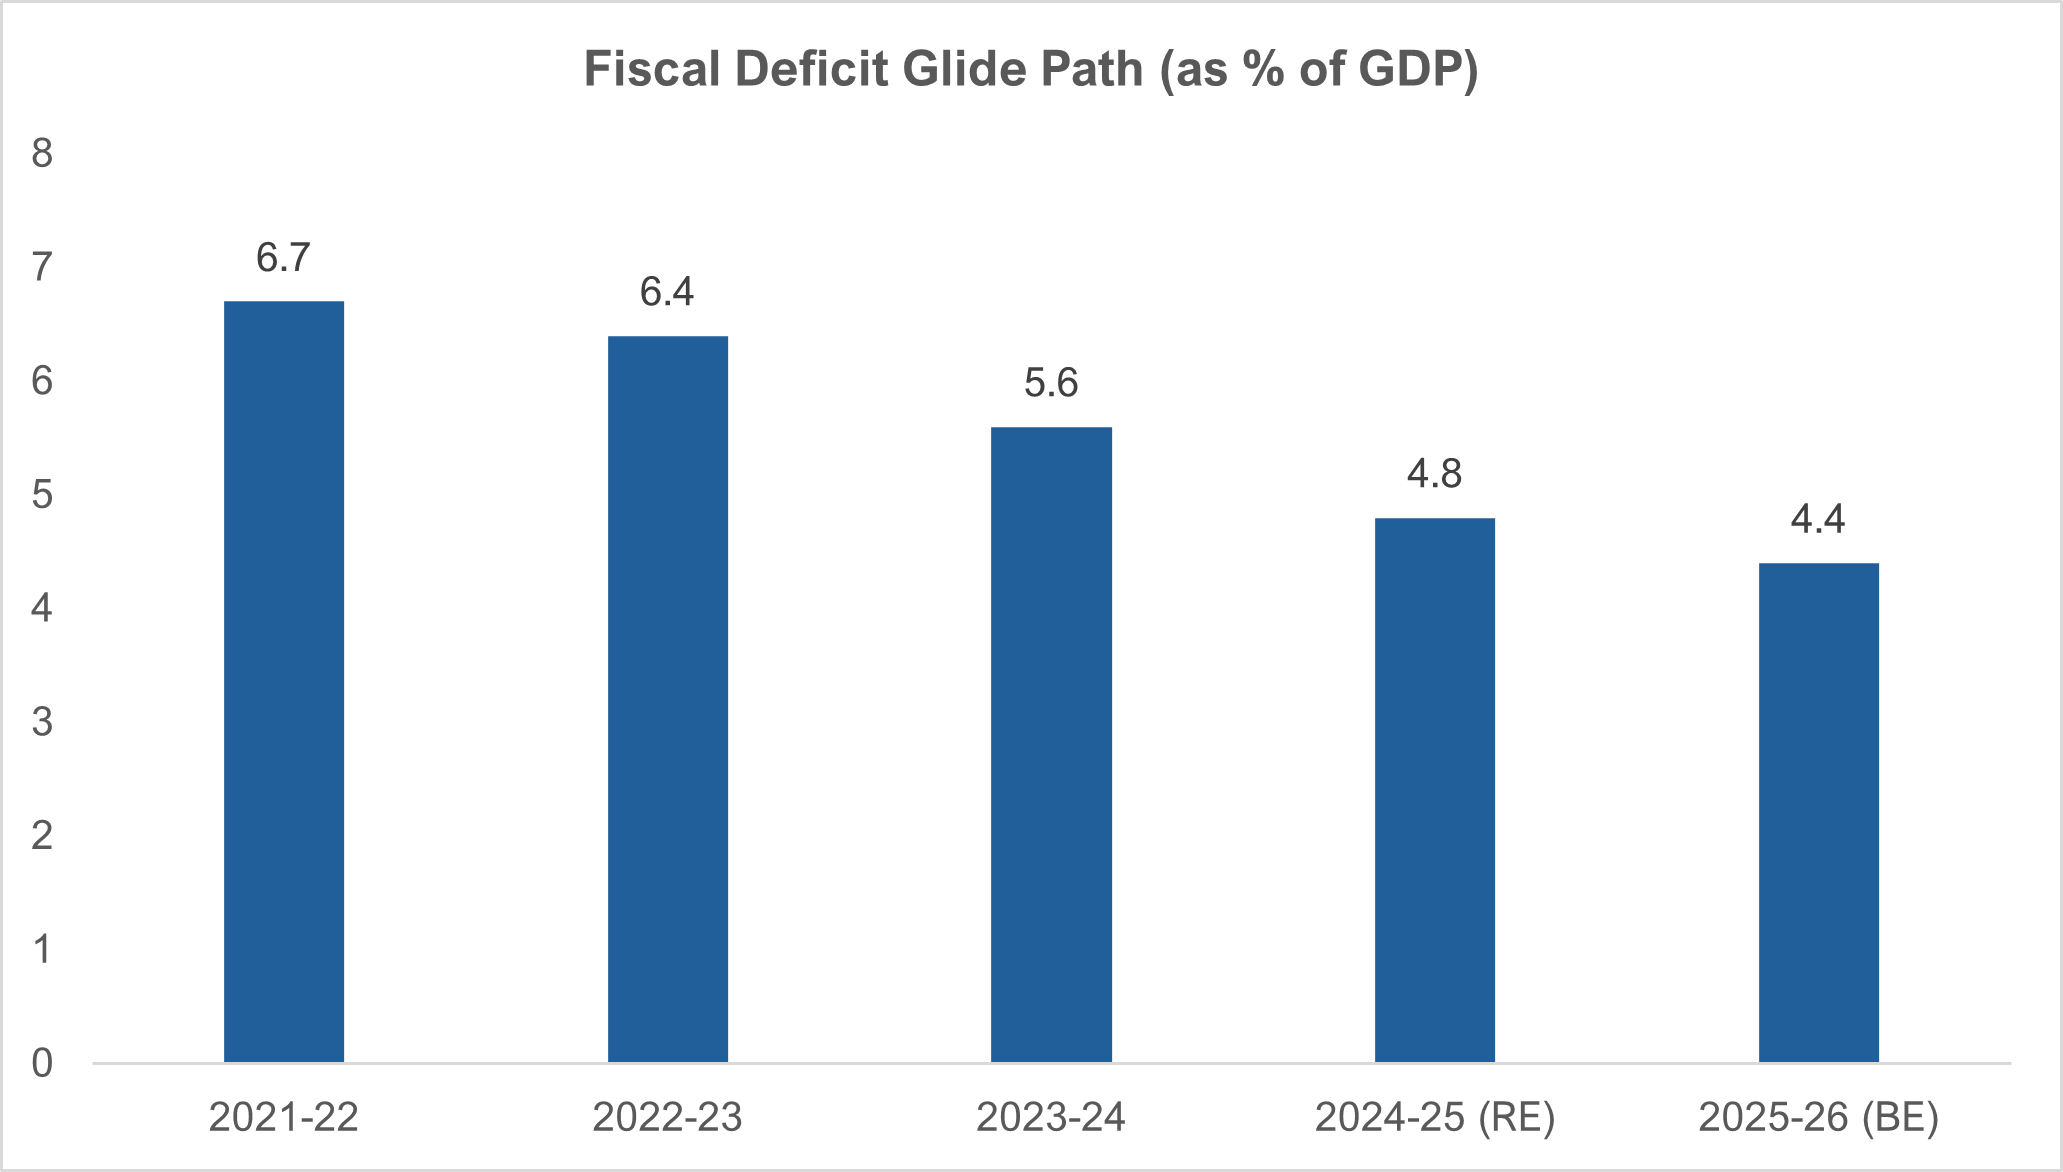
The Centre had budgeted a fiscal deficit of ₹5,23,846 crore, or 4.4% of GDP, and the note suggests that based on the first advance estimate it could be marginally lower, provided the government sticks to receipts and expenditure projections, weak tax revenue growth, potential GST rate rationalization effects, and support from higher dividend transfer by RBI, alongside expenditure mix management (slower revenue expenditure and stronger push on capex).
$4 Trillion Milestone and “Scale Signaling”
India is on course to cross $4 trillion in FY 2025 – 26 at the current exchange rate, and that the move from $3 trillion to $4 trillion is expected over four years. It further notes a specific illustrative assumption: if the rupee averages 89.28 per US dollar in FY 2025 – 26, then based on the NSO first advance estimate of nominal GDP, India is on course to touch $4 trillion. India is now the fourth largest economy behind the US, China and Germany, with the government stating last month that India overtook Japan to reach number four.
What this means for CXOs, Investors, and Operators
Implications for Corporate Budgets
- Plan for services-led demand strength with selective manufacturing upside. The growth mix suggests stronger momentum in services-linked revenue pools, while industrial recovery supports B2B and supply chain ecosystems.
- Keep a tight view on rural-linked and commodity-linked exposure. Agriculture moderation and mining contraction can affect demand pockets and input costs differently across sectors.
- Treat nominal growth as a planning constraint. With nominal GDP growth estimated at 8.0%, pricing and wage assumptions should be built bottom-up rather than applying broad-brush nominal uplifts.
- Build export resilience scenarios. Exports are estimated to hold up, but trade tensions remain an explicit risk in your data; plan for sector-specific tariff and non-tariff disruptions.
Implications for Investors and Transaction Teams
- Validate where the target’s growth is coming from. A services-led macro environment favors some business models materially more than others.
- Stress test earnings quality under low nominal growth. The risk is less about demand collapse and more about margin durability and cash conversion.
- Track fiscal stance signals. If capex remains a policy priority while deficit targets are preserved, infrastructure-linked ecosystems and suppliers can benefit, but working capital discipline remains critical.
What to Watch Next
- The next NSO update cycle. Second advance estimates will follow; verify the precise release date before publishing.
- GDP series base-year revision to 2022 – 23. This can affect trend comparability and may require restating historical charts used in investor materials and annual plans.
- The drivers that are explicitly soft in the estimate: agriculture moderation and mining contraction.
- Trade tensions as a continuing “known unknown” affecting selected export and import-reliant sectors.
References: Economic Times & Times of India