Executive summary
- Two new CEEW studies estimate a ₹3,700 crore market in 2047 for recovering materials from end-of-life solar modules, with recycling able to meet up to 38% of sector inputs and avoid 37 Mt CO₂ by substituting virgin resources.
- India could generate over 11 million tonnes of solar waste by 2047, requiring ~300 recycling plants and ~₹4,200 crore in cumulative investment.
- Today’s economics are challenging – recyclers face losses of ₹10,000 – ₹12,000 per tonne, driven primarily by the cost of buying back waste modules. CEEW flags EPR credits, tax incentives, and R&D in silicon/silver recovery as enablers.
- Solar PV is now covered under India’s E-Waste (Management) Rules, 2022 (EPR framework), laying the regulatory base for collection and recovery targets.
Market Context
India’s solar build-out is accelerating, and with it the stock of aging modules. CEEW’s new research projects more than 11 million tonnes of cumulative solar waste by 2047, predominantly crystalline-silicon modules, creating both an environmental challenge and a manufacturing opportunity if materials are recovered at scale. The think-tank estimates a ₹3,700 crore market by 2047 for extracted silicon, aluminium, copper, and silver, with circular inputs that could supply up to 38% of the sector’s needs and avoid ~37 million tonnes of CO₂ by displacing virgin production.
The scale implications are significant. To manage this flow, India would need about 300 recycling facilities nationwide and roughly ₹4,200 crore in cumulative plant investments through 2047. Media coverage has echoed the magnitude and timing of the waste curve.
Business Model & Value Chain
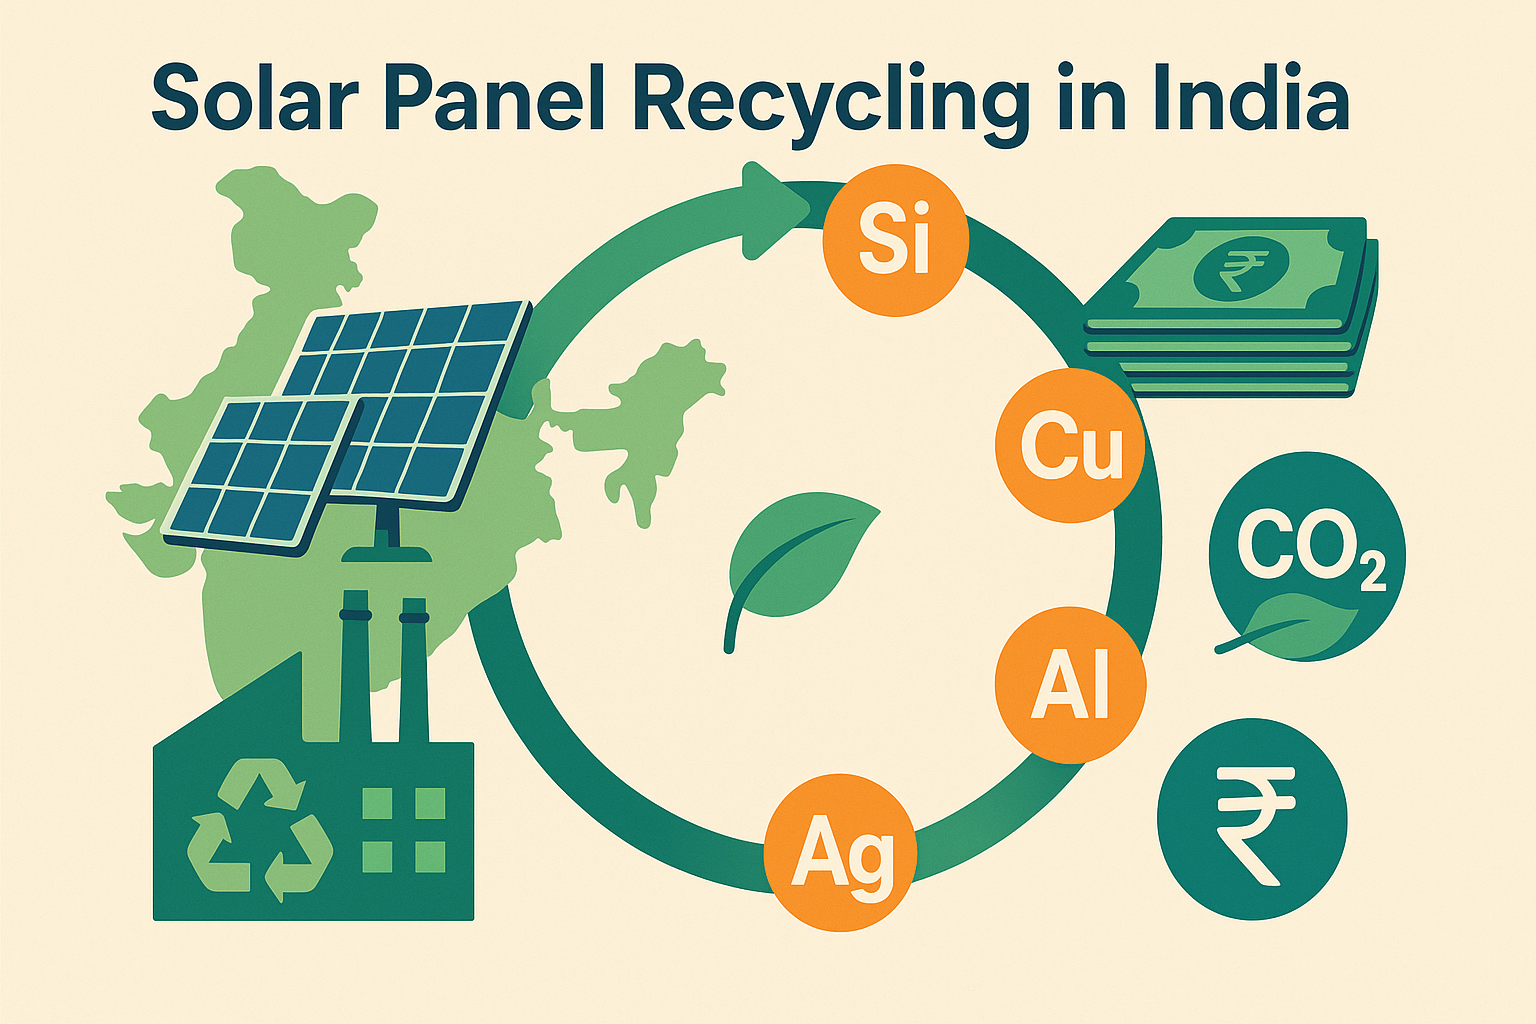
Solar recycling spans four linked steps:
(1) collection and logistics from utility-scale parks, C&I rooftops, and distributed assets
(2) pre-processing (diagnostics, safe dismantling, frame and junction box removal)
(3) process routes: mechanical, thermal, or chemical, for glass, aluminium, copper, silver, and silicon recovery
(4) refining to achieve purity thresholds that make recovered materials substitutable in manufacturing.
The quality of recovered silicon and silver, and yield rates per tonne, determine value capture.
Today, limited commercial capacity exists and activity is concentrated among a few recyclers; formal economics remain adverse without policy support. CEEW’s cost analysis indicates recyclers incur losses of ₹10,000 – ₹12,000 per tonne under current conditions, largely because buying back waste modules accounts for nearly two-thirds of total cost. Where waste modules are available at zero cost, mechanical or chemical routes can turn positive on a per-tonne basis, illustrating the leverage of feedstock pricing and EPR incentives.
Unit Economics
- Cost stack today. The largest expense is the buy-back of discarded modules (CEEW estimates around the majority share of total cost per panel), followed by processing, collection, and compliant disposal. Negative margins of ₹10,000–₹12,000 per tonne are typical without support.
- Levers to reach breakeven. Outcomes improve when
- EPR-linked certificate revenues offset buy-back and logistics
- R&D improves recovery rates and purity for silicon and silver
- scale reduces fixed costs per tonne. Where waste is supplied at zero cost, CEEW models positive benefits of ₹15,000–₹17,000 per tonne depending on route.
- Capex footprint. A national network approaching ~300 plants implies staggered capex through 2047 of ~₹4,200 crore, with regional siting near solar parks and C&I clusters to cut inbound logistics.
Regulatory, Compliance & Risks
India has brought solar PV under Chapter V of the E-Waste (Management) Rules, 2022, introducing Extended Producer Responsibility for producers, recyclers, and refurbishers of PV modules/panels/cells. The framework mandates registration, recovery targets (as specified by CPCB), inventory reporting on the EPR portal, and adherence to CPCB SOPs.
CEEW’s policy blueprint recommends:
(i) EPR targets for collection and material recovery aligned to solar lifecycles
(ii) a Circular Solar Taskforce under MNRE to coordinate policy, finance, and industry
(iii) a centralized solar asset inventory to identify waste hotspots
(iv) product design changes for easy disassembly and higher material purity.
Key risks include informal handling, data opacity on material composition, and volatility in commodity prices that affects recyclate revenues. Investigative reporting highlights the environmental and social risks when waste flows into informal channels, underscoring the need for enforcement and viable formal economics.
Operating Playbook
- Producers/EPCs: Register under EPR, map installed base by batch and bill of materials and set up reverse-logistics partnerships in priority states with large park capacity. (Opinion)
- IPP/O&M owners: Create asset-level disposal policies, pre-qualification for recyclers, and SLAs for safe removal; start pilots to benchmark recovery yields and purity. (Opinion)
- Recyclers/Investors: Prioritise plants near Rajasthan, Gujarat, Karnataka, Tamil Nadu, and Andhra Pradesh; lock supply MoUs with producers; and evaluate hybrid mechanical-chemical lines that maximise silver and silicon yields.
- Policy makers: Operationalise EPR certificate trading and quality standards for recycled inputs; fund R&D for silicon/silver recovery and glass purification; unify data via a central solar inventory.

Scaling & Performance Improvement
A practical scale-up path is to
(1) start with high-throughput mechanical lines for glass/aluminium/copper
(2) bolt on targeted chemical recovery for silver and high-purity silicon as volumes justify capex.
Over time, design-for-recycling standards, glass lamination choices, backsheet materials, adhesives, can raise yields and reduce unit costs. Chain-of-custody data on EPR portals and batch-wise material passports would enhance traceability and credit monetisation.
Also Read: Electric Truck Production Boost: Blue Energy Motors Plans ₹3,500 Crore Investment in Maharashtra
Transaction Angle
- Greenfield vs. acquisition. Brownfield upgrades of existing e-waste facilities can compress time-to-market if they meet CPCB SOPs for PV modules; greenfield plants near solar parks optimise inbound logistics.
- Diligence red flags. Over-reliance on paid feedstock without EPR revenue, lack of purity specs that meet downstream buyers’ requirements, weak offtake for recyclates, and exposure to informal channels.
- Valuation lenses. Model dual revenue streams, material recovery plus EPR certificates, and stress-test commodity prices and collection rates; pace capex in line with retiring cohorts of modules.
FAQs
- What volumes justify a plant? CEEW’s roadmap implies ~300 facilities by 2047 distributed near waste hotspots, regional plants de-risk logistics.
- Is recycling profitable today? Not typically, losses of ₹10,000 – ₹12,000 per tonne are common without feedstock support or EPR credits.
- Which materials matter most? Aluminium and glass by mass; silver and high-purity silicon by value. R&D lifts recovery and purity, improving economics.
- What policy instrument changes the game? Enforceable EPR targets plus tradable certificates and robust data transparency on the national portal.
How HMSA can help
If you are evaluating entry into this space, or scaling an existing operation, HMSA Consultancy brings hands-on support across strategy planning, performance improvement, and transaction support. We develop evidence-based business plans, size markets with defensible assumptions, design operating models and KPIs, optimize cost and working capital, and run end-to-end diligence and deal support. To explore how these levers apply to your context, reach out for a focused discussion with our senior team.
Reference: ANI News
